Global mean surface temperatures operate on a compounding baseline of anthropogenic warming, but the acute year-on-year variations are dictated by the planet’s largest thermal engine: the El Nino Southern Oscillation (ENSO). Instrumental data from the first half of 2026 confirms that the tropical Pacific has transitioned out of its brief neutral state and is rapidly generating a high-amplitude warm phase. Dynamical ensemble models from the National Oceanic and Atmospheric Administration (NOAA) and the European Centre for Medium-Range Weather Forecasts (ECMWF) now project a 60% probability that sea surface temperature (SST) anomalies in the Nino 3.4 region will exceed the $2.0^\circ\text{C}$ threshold by December 2026. This metric formally classifies the unfolding event as a "Super El Nino."
The widespread media focus on immediate weather disruptions obscures the primary thermodynamic reality: the true peak of global atmospheric warming will not materialize until 2027. This delayed reaction is not a statistical anomaly but the mechanical consequence of oceanic-atmospheric heat transfer. To evaluate the trajectory of global temperatures over the next 24 months, analysts must dissect the precise physical bottlenecks, lagging mechanisms, and economic cost functions that define this planetary thermal surge.
The Tri-Phase Thermodynamic Engine
The transition to a Super El Nino is governed by a sequence of coupled oceanic and atmospheric feedback loops. Understanding why 2027 is positioned to surpass 2024 as the hottest year on record requires breaking down this transition into three distinct mechanical phases.
[Phase 1: Trade Wind Collapse]
       │
       ▼
[Phase 2: Thermocline Flattening & Kelvinitic Heat Release]
       │
       ▼
[Phase 3: Atmospheric Boundary Layer Absorption (3–6 Month Lag)]
Phase 1: The Trade Wind Collapse and Kelvin Wave Propagation
Under baseline neutral conditions, the Walker Circulation drives strong easterly trade winds across the equatorial Pacific. These winds pile up warm surface water in the Western Pacific Warm Pool, maintaining a steep thermocline—the boundary layer separating warm surface water from the frigid deep ocean—that tilts upward toward South America.
The initiation of El Nino begins when localized atmospheric pressure drops over the central Pacific, weakening or entirely reversing these easterly trade winds. This collapse eliminates the stress that holds the Western Pacific Warm Pool in place. The accumulated thermal energy releases eastward in the form of downwelling equatorial Kelvin waves. These sub-surface waves travel thousands of kilometers across the Pacific basin, depressing the thermocline as they move and preventing the typical upwelling of cold water along the Peruvian coast.
Phase 2: Thermocline Flattening and Surface Boundary Layer Anomalies
As the thermocline flattens, a massive volume of warm water, historically insulated below the mixed layer, is exposed to the surface across the central and eastern Pacific. By October 2026, model averages indicate that SST anomalies in the critical Nino 3.4 zone—spanning $5^\circ\text{N}–5^\circ\text{S}$ latitude and $170^\circ\text{W}–120^\circ\text{W}$ longitude—will reach $+2.2^\circ\text{C}$ to $+2.7^\circ\text{C}$. This massive surface area acts as a giant radiator. The expanded thermal footprint shifts the primary zone of tropical convection from the western Pacific to the central basin, fundamentally altering the global jet stream configuration.
Phase 3: The Three-to-Six Month Atmospheric Lag Function
The core miscalculation in standard climate reporting is the assumption that peak ocean warming equates to immediate peak atmospheric warming. In reality, the transfer of energy from the ocean surface to the upper troposphere is throttled by a structural delay.
- Sensible and Latent Heat Flux Constraints: The ocean releases heat primarily through evaporation (latent heat flux). This moisture must lift, condense into clouds, and release its latent heat into the troposphere before it registers in global lower-atmosphere temperature datasets.
- Tropospheric Mixing Efficiency: The planetary boundary layer takes months to distribute this localized tropical energy across mid-latitude and polar air masses via planetary waves.
Historical data from the monumental 1997–1998 and 2015–2016 ENSO cycles demonstrates that the maximum global atmospheric temperature response lags the peak Pacific SST anomaly by roughly three to six months. Because the current 2026 El Nino is modeled to peak between November 2026 and January 2027, its maximum contribution to the global atmospheric heat ledger will land squarely in the second and third quarters of 2027.
Quantifying the Thermal Stack: Baseline vs. Variable Forcing
To determine the probability of 2027 breaking global temperature records, the analysis must isolate long-term systemic warming from cyclical natural variations. The global temperature anomaly for 2027 can be conceptualized as a multi-variable function:
$$T_{\text{total}} = T_{\text{baseline}} + T_{\text{ENSO}} + T_{\text{forcing}}$$
The components of this equation dictate the final thermodynamic state.
The Anthropogenic Baseline ($T_{\text{baseline}}$)
Human-induced greenhouse gas emissions add a continuous heat load to the global system. This baseline increases linearly at approximately $0.02^\circ\text{C}$ per year. The baseline background climate of 2026/2027 is profoundly different from that of previous super El Nino cycles. The three most recent La Nina years (characterized by cooler equatorial Pacific waters) were warmer than the historic Super El Nino year of 1998. The planetary system has accumulated so much background thermal energy that even minor positive fluctuations yield unprecedented absolute temperatures.
The ENSO Variable ($T_{\text{ENSO}}$)
A standard El Nino event typically adds roughly $0.1^\circ\text{C}$ to $0.2^\circ\text{C}$ to the global mean surface temperature anomaly during its peak phase. A Super El Nino, where SST anomalies breach the $+2.0^\circ\text{C}$ threshold across millions of square kilometers, injects significantly more energy into the atmospheric system. The Finnish Meteorological Institute and the UK Met Office estimate that the upcoming event will add up to $0.25^\circ\text{C}$ to the global average on its own.
Secondary Forcing Agents ($T_{\text{forcing}}$)
This variable includes volatile factors such as solar cycle peaks, marine sulfur emission regulations which reduced aerosol cooling, and lingering stratospheric water vapor from sub-surface volcanic eruptions.
The World Meteorological Organization (WMO) leverages these inputs to project an 86% probability that at least one year before 2030 will shatter the 2024 temperature record. Given that 2026 began with neutral-to-cool conditions, Carbon Brief models project only a 19% chance that 2026 takes the top spot, positioning it instead as the second-warmest year on record. The mathematical certainty shifts to 2027: if the 2026 ocean warming hits predicted metrics, 2027 becomes the statistical certainty for the highest global temperature anomaly since modern instrumentation began.
Regional Asymmetry and Hydroclimate Bottlenecks
Global temperature averages flatten out local realities. A Super El Nino does not warm the planet uniformly; it creates severe regional climate anomalies by disrupting the atmospheric jet streams. The resulting impacts present distinct hydroclimate risks across different geographies.
The Evaporative Sponge Effect
The physical mechanism driving these extremes is the Clausius-Clapeyron relation. For every $1^\circ\text{C}$ of atmospheric warming, the air’s water-vapor holding capacity increases by approximately 7%. In a Super El Nino year, this relationship accelerates hydrologic volatility. The atmosphere acts as an expanding sponge, evaporating moisture rapidly from vulnerable landmasses and dumping it violently when condensation thresholds are met.
Geographic Impact Matrix
| Region | Primary Mechanism | Primary Risk Vectors |
|---|---|---|
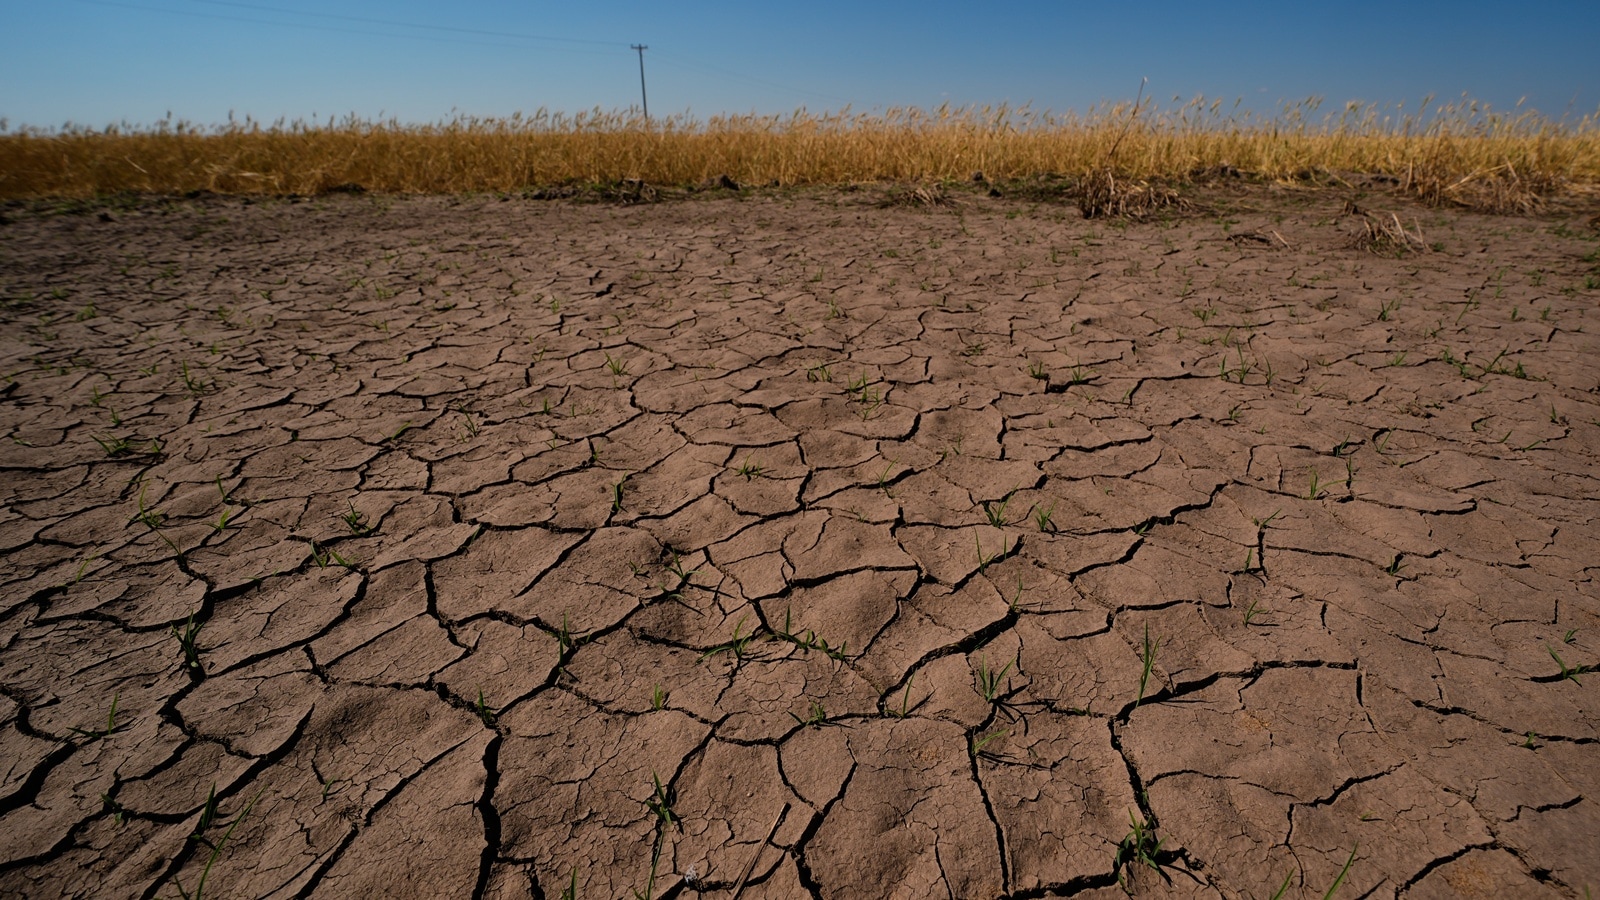
| Maritime Continent & Australia | Subsidence branch of shifted Walker Circulation suppresses cloud formation. | Severe drought, water table depletion, catastrophic wildfire conditions. |
| Western South America | Direct proximity to downwelling Kelvin wave; intense local convective lifting. | Flash flooding, infrastructure destruction, collapse of coastal pelagic fisheries due to thermocline depression. |
| Southern United States & Gulf Coast | Subtropical jet stream splits and moves south, carrying persistent low-pressure systems. | Elevated winter precipitation, severe riverine flooding, suppressed Atlantic hurricane initialization via high wind shear. |
| Indian Subcontinent | Disruption of the southwest monsoon onset via altered thermal gradients. | Insufficient agricultural water supply, amplified pre-monsoon wet-bulb temperature crises. |
The Macroeconomic Cost Function
The macro-environmental impacts of a Super El Nino carry severe economic liabilities. Historical analysis published by Stanford climate economists outlines a quantifiable suppression of gross domestic product (GDP) growth following major ENSO events. The financial fallout operates through three primary economic bottlenecks.
1. Agrarian Supply Chain Destabilization
The correlation between a Super El Nino and reduced crop yields in critical global breadbaskets is well-documented. Drought conditions across India, Thailand, and eastern Australia directly threaten rice, sugar, and wheat production. Conversely, excessive rainfall in South America disrupts soy and coffee harvesting schedules.
The resulting supply shocks trigger global commodity price volatility. Because agricultural markets operate on thin surplus margins, a minor percentage drop in global crop yields causes exponential price increases, straining food security systems in import-dependent developing nations.
2. Infrastructure Depreciation and Energy Grid Failures
The combination of elevated baseline temperatures and El Nino forcing creates unprecedented demands on regional energy infrastructure.
- The Cooling Demand Bottleneck: Extended heatwaves elevate peak electricity demand for air conditioning, pushing regional grids to their transmission capacities.
- The Generation Efficiency Deficit: Thermal power plants (nuclear, coal, gas) experience reduced cooling efficiency when source water temperatures rise. Concurrently, prolonged droughts diminish hydro-electric reservoir capacities across Southeast Asia and South America, choking off energy generation precisely when demand peaks.
3. Long-tail Capital Diversion
The systemic cost of a Super El Nino is not fully captured by immediate insurance payouts for storm or fire damage. The deeper economic drag is the diversion of capital. Governments and multinational corporations are forced to reallocate capital away from productive research, development, and infrastructure expansion. Instead, these funds are consumed by reactive expenditure: repairing destroyed transport links, subsidizing climate-stressed energy grids, and funding disaster relief operations. This structural shift lowers the long-term economic growth trajectory for years after the physical weather pattern dissipates.
Strategic Asset Allocation Under Hyper-Thermal Forcing
As the tropical Pacific moves toward historic thermal anomalies, waiting for late-stage consensus reports introduces unmanageable organizational risk. Executive leadership, supply chain operators, and asset managers must transition from speculative observation to active risk mitigation. The data points to 2027 as an operational bottleneck. Navigating this environment requires executing targeted strategic adjustments across key operational areas.
Supply Chain Resiliency and Resource Hedging
Sourcing teams must audit their exposure to vulnerable agricultural and industrial hubs across the Maritime Continent and western South America. Organizations should diversify their supplier portfolios away from single-source hubs in impacted areas, establish long-term forward contracts to buffer commodity price spikes, and increase safety stock volumes for critical raw materials before the fourth quarter of 2026.
Infrastructure Hardening and Energy Security
Operations managers must stress-test localized assets against sustained wet-bulb temperature anomalies and grid instability. This requires investing in decentralized, off-grid backup power installations, upgrading industrial HVAC and thermal cooling systems to maintain efficiency at higher ambient baselines, and implementing aggressive water-recycling protocols to protect against localized municipal shortages.
Capital Allocation and Risk Valuation
Financial planners must integrate hyper-thermal variables into their long-term asset valuation models. Organizations should reprice real estate and infrastructure investments situated in vulnerable floodplains or wildfire corridors, adjust corporate insurance policies to account for systemic multi-region extreme weather events, and shift capital investments toward climate-resilient technologies and adaptive infrastructure.